In startups, EVERYONE uses Google Sheets:
- Marketers track goals and results for campaigns
- SEO experts perform keyword and backlink research
- Content producers manage an editorial calendar
- And tons more…
But the best of the best use Google Sheets differently than most. The experts use Sheets to automate their work.
To help you take your Google Sheets game to 💯, meet David Krevitt.
David is the Mozart of Google Sheets. Ha, 2017 composer!
Time-consuming tasks which take most entrepreneurs hours, David is able to do in just minutes. (Thanks, Google Sheets automations.)
To show you what Google Sheets can do you for your business, I invited David to share his best-kept secrets. Use these tricks to dominate your Sheets game.
Plus, you’ll see real-life examples on how other successful companies (like Zapier) use Google Sheets for massive success.
Take it away, David…
- How to Master Google Sheets
- How Kettle & Fire Uses Google Sheets: Optimize an Ecommerce Funnel
- How Zozi and Zapier Use Google Sheets: Manage a Distributed Content Team
- How Podia Uses Google Sheets: Conduct Content Research
- How Webris Uses Google Sheets: Delete Useless Pages From a Site
- Bonus: Curing “Data Puke” in Web Analytics
- How to Use Google Sheets to Kickstart Your Own Domination
- What’s Next?
How to Master Google Sheets
If you want to become effective at Google Sheets, it’s important to learn the Google Sheets basics first.
There are 3 critical skills to learn:
Skill #1: Pull Raw Data into Sheets
Most people are inputting data in Google Sheets completely wrong.
(Yes, I’m looking at you.)
The Sheets Novice will export CSV files from tools like Google Analytics, Facebook Ads, Moz, or anywhere else… and then try to import the files into Google Sheets.
Importing data this way is a pain in the ass. Plus, it takes forever to clean up.
Instead of manually importing a CSV file, I have a strategy to save you tons of time.
I call it the “Lazy Toolbelt.”
The Lazy Toolbelt is a collection of Google Sheets add-ons to pull data from your favorite services directly into Sheets with the press of a button.
My toolbelt includes:
The fun part is taking data from these three pieces of my toolbelt automatically, which lays the foundation for any Sheets template.
Let’s take a look at how you can automate each part of your toolbelt…
Toolbelt Item #1: Blockspring
Blockspring is a Google Sheets add-on, which means you can set up data pulls from within your sheet.
First, install Blockspring from the “Add-ons” menu in a Google Sheet. Then, open it from the same menu and you’ll see a screen which looks like this:
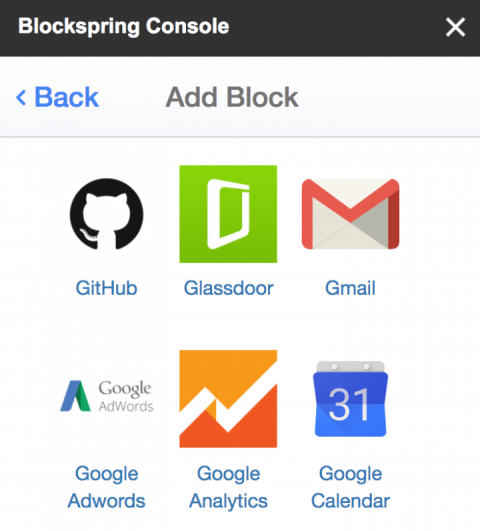
I primarily use Blockspring for research, scraping and communication. In other words, any task which requires chaining more than one dataset together or sending messages out to my team.
An example is grabbing all links from a page (something I do all the time for SEO research). Search for “get links” in the Blockspring sidebar, and you’ll find this Block:
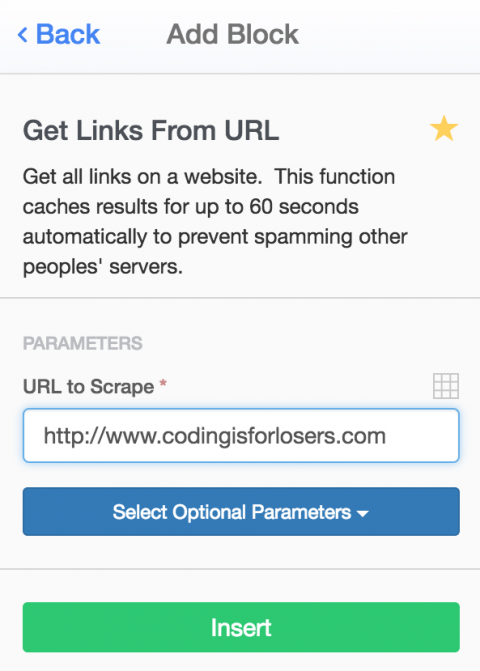
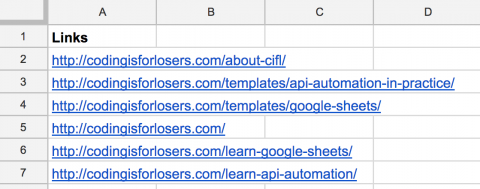
Inserting it will automatically drop a list of links into your Google Sheet:
You can also set Blocks to refresh on a timer, without you opening or touching the Sheet. In other words, you can fire yourself from being a data jockey. 💪
Fore more experimenting, check out a few of my favorite Blockspring Blocks:
Toolbelt Item #2: Supermetrics
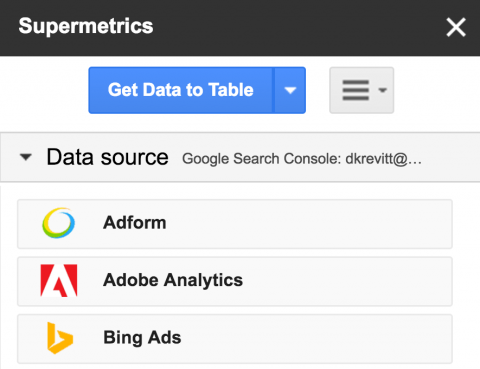
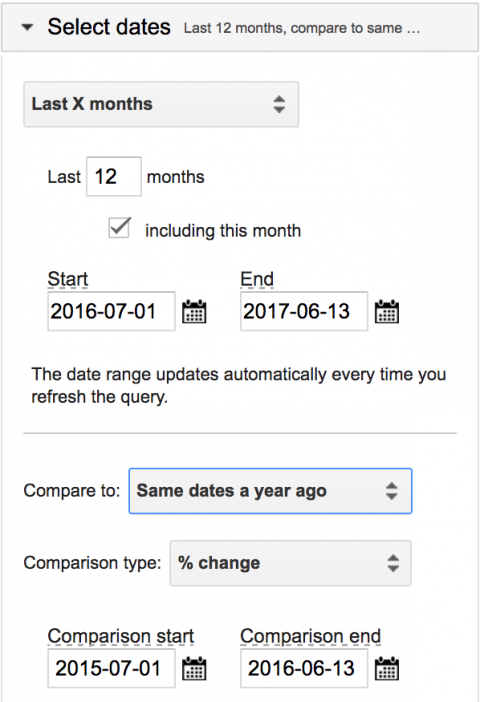
I use Supermetrics primarily for web analytics and paid acquisition reporting, because their data pull setup has three killer features:
- Automatically pull data from a comparison period (week-over-week, month-over-month, year-over-year…)
- Use Supermetrics’ “Split by” menu to aggregate data by calendar seek (my go-to reporting period for this type of data)
- Schedule automatic emailing of reporting to your team

My favorite template in Supermetrics is the Facebook Ads + Adwords Dashboard.
Data from Supermetrics is formatted perfectly for Google Data Studio, aka the sexiest free dashboarding tool out there.
So you can easily combine all of your campaign results into one dashboard:

Toolbelt Item #3: Zapier
Zapier allows you to send new data from almost ANY tool into Google Sheets as a new row.
Here’s why this is a big deal: If I want to use it to send any new email subscribers to a Sheet, I can keep my spreadsheet CRM up to date.
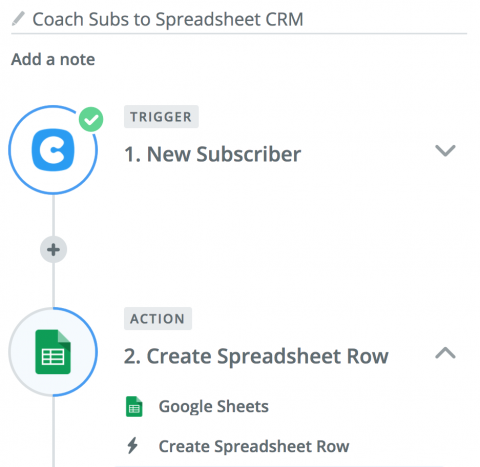
My two favorite Zaps:
Skill #2: Turn Your Raw Data into Something Useful
What good is automatically pulling in data if you don’t know what to do with it?
Automating your data process can save tons of time, but it’s just the beginning. Now, it’s time to massage your data into actionable insights.
I’ve tested hundreds of Google Sheets formulas. Some of them are good, most are not.
To help you cut through the fluff, I’m going to give you the three MOST important formulas.
Below are three of the most critical formulas to learn. If you’d like to dive right in, grab a copy of the cheat sheet to learn them interactively.
| BONUS: Get the Google Sheets formula cheat sheet |
Formula #1: IF
The IF function is the first formula you’ll need in Sheets.
It lets you flex your conditional logic muscles, and control when other functions execute.
Say you’re analyzing data from Twitter in Google Sheets, and wanted to tag Tweets as either having Retweets or not. IF would be your vehicle for tagging them:
=IF (A2 > 0, “Has Retweets”, “No Retweets”)
- The first element (“A2 > 0”) is your logic (assuming column A contains the count of Retweets)
- The second element (“Has Retweets”) appears if the logic is TRUE
- The third element (“No Retweets”) appears if it’s FALSE.
You can also use IF to avoid running a function unless the cell it’s supposed to run on is populated.
=IF(A2 = “”, do nothing, run this function)
This keeps your sheets clean and fast. Otherwise, running a bunch of Google Sheets formulas unnecessarily will slow things down.
Formula #2: VLOOKUP
Say you had a list of Tweets in one tab of a Google Sheet, and you wanted to look up the most recent tweet for a Noah’s Twitter handle:
=VLOOKUP ( “noahkagan”, ‘Tweets’!A:E, 3, 0 )
VLOOKUP pulls data from one dataset (‘Tweets’!A:E), that matches your search term (“noahkagan”), and returns the column number that you need (3 in this case).
VLOOKUP can level up your Sheets game to crazy heights, so consider it the gateway drug of Sheets formulas. Here are more advanced details on VLOOKUP.
Formula #3: QUERY
What if you wanted to build a table displaying the total number of Tweets and Retweets for Noah’s Twitter?
That’s where QUERY comes in. It allows you to build a list of metrics from the comfort of one formula.
Without QUERY, we’d have to use two separate SUMIF statements:
- Tweets where the handle is “noahkagan”
- Retweets where the handle is “noahkagan”
This extra complexity will bog down your Sheet, and eventually slow it down to a crawl.
With QUERY, all of that logic and math can be packed into one formula:
=QUERY ( ‘Tweets’!A:F, “select A, count(E), sum(F) where A = ‘noahkagan’ group by A label A ‘Handle’, count(E) ‘Tweets’, sum(F) ‘Retweets'” )
First, you specify the data range you’re pulling from: ‘Tweets’!A:F in this case.
Then, you spell out your logic step-by-step in the query itself:
- “Select A, count(E), sum(F)”: pull the handle, count of Tweets, and sum of Retweets
- “Where A = ‘noahkagan'”: pull only rows where the handle equals Noah’s handle
- “Group by A”: aggregate all rows by handle
- “Label A ‘Handle’, count(E) ‘Tweets’, sum(F) ‘Retweets'”: sets column headers for your results
If you find your Sheet slowing down, drowning in a sea of formulas, the QUERY will save you.
In my opinion, learning to write queries (in Sheets or SQL) is the single most valuable move you can make for your career. Here are some advanced tips for QUERY.
Skill #3: Make the Data Usable and Easy for Your Team
After we pull our raw data into Sheets and turn it into something useful, it’s time to make it usable for our team.
When our goal is to communicate what we’ve learned from data, visualizations are our best friend:
- Charts
- Tables
- Sexy combinations of charts and tables (aka baller dashboards)
You can build charts, tables, and dashboards directly within Sheets — but if you’re really looking to make life easy on your team, connect Sheets to Google Data Studio to make beautiful, interactive reports.
Making Data Usable: Prepping your Sheet for Data Studio
- Dates must be in yyyy-mm-dd or yyyymmdd format. Dates like “Mon May 3 2002 12:23:00” won’t be recognized
- Keep headers in the first row of your Sheet, and name them how you’d like them to display in Charts or Tables
- Each Google Sheets tab is equal to its own source in Data Studio, so anything you’d like to look at on the same chart needs to be in the same tab
Making Data Usable: Connecting your Sheet to Data Studio
Just be careful that your date column from the previous step was recognized.
Making Data Usable: Building Charts
If you’ve set your date column up in the last couple steps, you’re able to build time series charts to visualize changes over time.
This is a KILLER feature of Data Studio, since you can automatically track changes against the previous period (week-over-week) or against the same period last year (year-over-year).
To dive deeper into Data Studio, grab a copy of this Google Analytics report template.
How Do Other Startups Use Google Sheets?
You’ve seen what Google Sheets can do theoretically. Now, it’s time to see EXACTLY how other startups are using Google Sheets.
Each walkthrough includes a link to copy their template (including step-by-step setup instructions) — so you can mirror exactly what they’re doing.
How Kettle & Fire Uses Google Sheets: Optimize an Ecommerce Funnel
Wilson Hung, a growth marketer at Kettle & Fire, manages an army of affiliate promoters. The affiliates sell the company’s bone broth product through their blogs and newsletters.

Here’s the tough part: Because each promoter is their own marketing campaign — and needs to be tracked, compared, and analyzed — Wilson spent hours every week putting data together.
But after digging into the power of Google Sheets, he knew there had to be a way to speed up the tracking, comparison, and analysis process.
After tons of trial-and-error, he found it. Here’s how he automated his ecommerce funnel.
Step 1: Raw data
To track a funnel, you need to track web traffic and sales.
Here’s how Kettle & Fire did it:
- Web traffic: Supermetrics to pull Google Analytics data into Sheets
- Affiliate sales: Zapier to send Clickfunnels data (their shopping cart) into Sheets
Step 2: Formulas
To measure the success of an affiliate campaign, Wilson had to calculate the conversion rates for two main steps of the funnels:
- Landing page to checkout
- Checkout page to purchase
To accomplish, he used VLOOKUP and QUERY formulas:
- VLOOKUP to tie all of the Google Analytics and Clickfunnels data together
vlookup(D2:D,{‘Funnel Setup’!B:B,’Funnel Setup’!A:A},2,0) vlookup(D2:D,{‘Funnel Setup’!B:B,’Funnel Setup’!A:A},2,0)
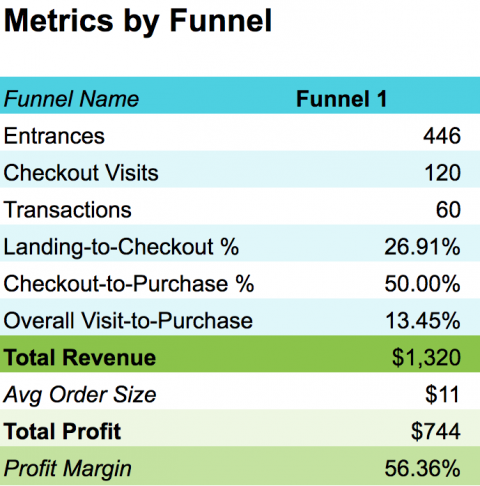
- QUERY to calculate the metrics. This one’s a doozy, but if you break it down it’s essentially summing up all of the metrics contained in the visualization below.
query(‘Aggregated Data’!A:P,”select A, sum(E), sum(F), sum(J), sum(F)/sum(E),sum(J)/sum(F),sum(J)/sum(E),sum(H),sum(H)/sum(I), sum(N),sum(N)/sum(H) where A != ” group by A label sum(E) ‘Entrances’, sum(F) ‘Checkout Visits’, sum(J) ‘Transactions’, sum(F)/sum(E) ‘Landing-to-Checkout %’,sum(J)/sum(F) ‘Checkout-to-Purchase %’,sum(J)/sum(E) ‘Overall Visit-to-Purchase’,sum(H) ‘Total Revenue’,sum(H)/sum(I) ‘Avg Order Size’, sum(N) ‘Total Profit’,sum(N)/sum(H) ‘Profit Margin'”,1)
Step 3: Visualization
The final output of Wilson’s analysis was a table with funnel metrics compared across each of their affiliates. A simple table in Sheets:
The results: Wilson and team used this process to track the results and see their “weak links.”
Once identified, they were able to focus their efforts on the parts of the business which needed to be improved — and they boosted their visit-to-purchase rate by over 100% in just 5 months.
If you’re selling a product online, grab their template here.
How Zozi and Zapier Use Google Sheets: Manage a Distributed Content Team
Two companies. Two content teams. Two completely different approaches.
One company wrote blog posts, the other built landing pages.
But even with the differences, there was a similarity. Both managed a distributed team of writers remotely — and both relied upon Google Sheets to keep their editorial ship moving with a league of contributors.
Zozi: Solving for volume
Zozi was a marketplace of local activities and getaways (since acquired by Peek), so Cyndy Willis-Chun of the Zozi team needed to build unique landing pages for each new business who listed on their site.
Their volume was no joke: They regularly built hundreds of landing pages at a time.
To manage the process, Zozi decided to build a series of Google Forms and Sheets. Once optimized, this took Cyndy’s time to prepare 200 freelancer assignments down from 10 hours to 10 minutes.
“Automating with Google Sheets meant that we could give writers feedback, and do higher quality work. Our moods improved considerably, and there was much less swearing in the office.”
Zapier: Solving for consistency
Matthew Guay and the Zapier team had to-do lists and deadlines which sounded good on paper, but didn’t fit how they actually published their content.
To help them focus on how content is actually created, Matthew and his team built an editorial calendar in Google Sheets. After they launched, they were able to keep an accurate view of their content pipeline.
“It’s a great way to manage editorial process for smaller teams, when there’s just enough clutter to make it tough knowing what’s getting published and when.”
To help you manage your content, I worked with Matthew and Cyndy to produce a template.
This template passes data from Google Forms → Google Sheets → Google Calendar → WordPress.
Step 1: Raw data
A Google Form is used to push new content ideas into Sheets (including their title, slug, preliminary publish date, etc.).
These ideas can then be pulled into the Editorial Calendar.
Step 2: Formulas
This template mainly relies on VLOOKUP to pull data on each post from the Google Form into the Calendar.
vlookup(B2:B,Posts!B:E,4,0)
Step 3: Visualization
Since the purpose of this template is to manage a content production pipeline, the output is an editorial calendar which can be used to track progress of each post:
![]()
It allows you to push posts directly to WordPress or your Google Calendar. You can read up on that by making a copy of the template.
How Podia Uses Google Sheets: Conduct Content Research
Spencer Fry launched Podia in 2016 as a platform for online tutors to sell online courses.

When Spencer started Podia (then called “Coach”), he thought it would be a small little thing for the occasional online tutor.
But then, a funny thing happened.
Podia blew up. People were using the platform for WAY more than just online tutoring.
Developers showed up to teach programming. Love coaches signed up to teach the law of attraction. Animators appeared to share their how-to tips for creating winning action scenes.
This threw a wrench Podia’s content strategy. Instead of writing content just for tutors, they needed to go much broader and appeal to developers, love coaches, animators, and more.
Reorganizing their strategy meant doing lots of research:
- What are our audiences talking about on Reddit?
- What are they Tweeting?
- What else are they reading?
Instead of collecting all the research in Word, iPhone Notes, or a disorganized Evernote file, Spencer found a way to use Google Sheets.
Step 1: Raw data
First, pull Twitter search data into Sheets using Blockspring, Supermetrics, or Zapier. These search keywords and hashtags can be changed on the fly as your audience changes.
Then, pull in Reddit posts using the Sheets ImportXML function. The template will pull in any posts which match your given keywords.
Step 2: Formulas
This template exclusively uses QUERY to pluck out top shared URLs, top mentioned influencers, and top questions asked from Twitter and Reddit.
=query(twitter_data!A1:Z,”select M, count(I) where M !=” group by M order by count(I) desc limit 100 label M ‘handle’, count(I) ‘mention count'”)
Step 3: Visualization
The output is a set of simple tables, showing posts to scan through. In other words, a filtered reading list to check each day when working on your content strategy.

Grab a copy of their social listening template here.
How Webris Uses Google Sheets: Delete Useless Pages From a Site
On the web, so much new content is created every day. Older content goes stale quickly.
Ryan Stewart and his company WEBRIS help companies keep their content updated and delete remove stale, harmful SEO pages.
“We only want people and search engines to see what best represents our business.”
Manually finding pages to cut (and pages to improve) is a data challenge:
- Do you look just at pageviews?
- Include metrics like bounce rate, exit rate, or pages per session?
- How do you measure what’s working and what’s not?
It gets messy quickly.
To easily tell which content to keep, delete, or refresh, Ryan and I developed an automated Sheet template:
Step 1: Raw data
Web data lives in so many different places, but this template pulls from all of them.
Traffic data lives in Google Analytics, and search data in Google Search Console. We pulled both into Sheets using Supermetrics.
The other data sources — backlink data from Ahrefs, keyword data from SEMrush, titles and meta descriptions from Screaming Frog — had to be imported via CSV, since they didn’t have easily available APIs to pull data into Sheets.
Step 2: Formulas
Since the main goal of this template is to pull data together from different sources, it leans heavily on VLOOKUP to aggregate data on one line for each page on a site.
vlookup(B2:B,’Supermetrics Data’!A2:D,3,0)
The rest of the formulas are simple math with IF / THEN statements:
IF a page has links and organic traffic, THEN leave it
IF a page has no links and no organic traffic, THEN delete it
The “Getting Started” variables in this formula are just looking up the thresholds for organic traffic, bounce rate and conversion rate that you set when configuring the template:
if(C2:C>’Getting Started’!$C$31,if(E2:E>’Getting Started’!$C$32,”QR”,if(D2:D>’Getting Started’!$C$33,200,”QR”)),if(F2:F=0,”QR”,301))
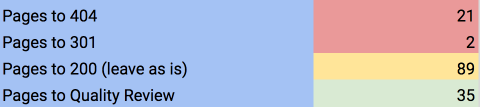
Step 3: Visualization
The final output of this template is a table, with one line for each page, containing each datapoint from web traffic to total links. Plus, a final recommendation on what to do with the page.
No more wasting time looking at six different analytics tools, or spending meetings talking about which content should be kept or deleted.
If you have a hunch that your site has some fat to trim, make a copy of the content audit template.
Bonus: Curing “Data Puke” in Web Analytics
Copy the template for your own business.
If you’re a startup, focus that will help you extract the most insight from your traffic data.
One of my favorite “simplification” Google Sheets hacks is from web analytics expert Avinash Kaushik. It pulls from Google Analytics’ “Acquisition Efficiency” report, which lets you quickly compare how effective your landing pages / acquisition channels are relative to each other.
Here’s how you get it started.
Step 1: Raw data
Pull Google Analytics data into Sheets using the Blockspring Add-on.
Step 2: Formulas
Use QUERY to pluck out the top performing acquisition channels / landing pages.
=query(‘Report 1’!E2:L,”select E, F, G, H, K, L where F > 0 order by F desc limit 10″,0)
Step 3: Visualization
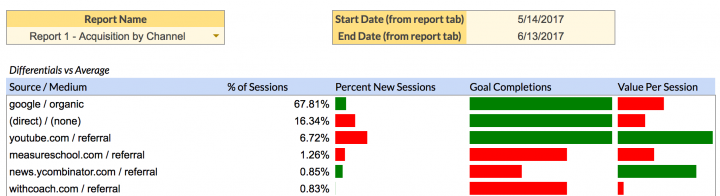
The output is what Avinash calls an “Action Dashboard.” In other words, a table with results in the first quadrant, and space for you to write in key insights for your team in the next three.
Key questions to answer for your team are:
- What does this data tell us?
- How did this behavior affect the bottom line?
- And what can we change or analyze further to improve?
How to Use Google Sheets to Kickstart Your Own Domination
You’re well on your way to mastering Google Sheets efficiency… and letting Google Sheets automatically do the most boring parts of your job. #winning
To recap the three layers:
- Pulling raw data into Sheets using the Lazy Toolbelt (Blockspring, Supermetrics and Zapier)
- Wrangling that data with a few key Sheets formulas (IF, VLOOKUP and QUERY)
- Building beautiful reports in Data Studio, so your team never has to crack open a Sheet
This is just the start.
I gave you the keys to the automation kingdom, so now you can create your own Google Sheets automations.
If you’re struggling to think of what other automations you can build — or you have too many you’re thinking of and want to prioritize — here’s my framework:
- What reports and research do you put together daily? Weekly? Monthly?
- Do any of these processes annoy you or take too long?
- Do the underlying tools you use connect to Add-ons like Zapier, Blockspring, or Supermetrics, so that you can pull raw data into Sheets?
What’s next?
Now that you understand how to use Google Sheets, it’s time to get behind the wheel and drive! The rest of your startup team will thank you.
If you’re serious about making your life easier with Google Sheets, you should do two things:
- Retweet this article (click the retweet button on the embedded tweet below)
- Leave a comment with your biggest takeaway from Google Sheets
For every person who retweets and leaves a comment, I’ll get a notification. Then, I’ll send you an exclusive, never-publically-released Google Sheets template vault.
This template vault will give you behind-the-scenes access to the BEST Google Sheets templates from the world’s most famous companies — saving you tons of time and automating parts of your job.
UNEARTHED: the master plan for automating your work in Google Sheets (from @noahkagan and @losersHQ) https://t.co/cN2HqK6Or5
— Coding is for Losers (@losersHQ) July 5, 2017
And if you run into any obstacles, I’m always available for help if you need it. You can reach out on my website or Twitter.
Thanks again to all of the startup friends — Wilson, Cyndy, both Ryans, Matt, Spencer and Avinash — who shared their Google Sheets templates and experience for this post.
28 responses to “8 Google Sheets Tips to Grow & Automate Your Business”
Awesome article and how-to. Thank you.
I’ve been in the dark for so long. There were some great tips to make the data more usable and presentable. Thanks for sharing
I’m just drooling at the automation setups! ???
Please let me know more templates, as these would be very handy to spark my mind in mixing these together.
Kind regards,
Mic
huge help!
Great insights about google sheets, thanks!
The clearest explanation of VLOOKUP and query I’ve ever seen. Fantastic post.
I’ve literally changed our entire quotation process using VLOOKUP, which will save our sales guys hours per week. Great post.
My biggest takeaway is that I need to master Google Sheets if I’m to set achievable yet ambitious objectives that I can influence via monthly and weekly activities. Please, PLEASE, I’m dyin for the template vault so I can learn more quickly. Thank you!
Didn’t realize you could do so much with Google Sheets! Great info :]
Over the last year or so I’ve been using Google sheets for invoicing and manually keeping track of data. In the last couple of weeks, I’ve been thinking of ways to automate tasks related to marketing and the solution keeps coming back to Google Sheets. It’s quite impressive. Thank you for the great post and the publishing automation template!
This is awesome! Didn’t realize Google Sheets could do so much. It’s going to be great automating data inputting to Sheets moving forward.
An excellent read and some brilliant time saving tips that will help you capture information you need to display or share with others
This post is amazing. Web analysts are becoming more and more in-demand. Anyone looking for a great resource on how to manage web analytics like a pro should check out David’s work.
Google sheets is an amazing tool, I really have to put more attention to it, thanks for the article.
Google Sheets is one of the most underrated tools out there. You have given me plenty to think about, but I’ll be using the Facebook ad template today. Thanks!
How on earth does this post only have 186 shares. I been reading this blog for years and this is easily one of the top 5 most valuable posts on here.
Damn! love this shit! Didn’t know that Google sheet can be THIS powerful! Tks for sharing!
Mind. Blown. I never thought of using Google Sheets as such a robust automation tool. I’ve only just begun to scratch the surface with Google Sheets, but the first thing I’m going to be doing is using it to delete stale pages from my site. Thanks for the awesome tips!
Correction due to fast fingers: not delete stale pages, but pull the data to tell me which pages to delete. 😉
this is worth the little bit of work to better visualize my data. I plan to use this to analyze my Facebook ads data instead of paying a monthly subscription to have it done for me.
Great insights about google sheets, thanks!
Fantastic post! I’ve been following David since being introduced to his mastery of Google Sheets through Webris. This really is the future of data research and opens up the field to all non-developers.
This is super helpful. Thank you!
Great tips, very inspiring. When you start building an army of Google Sheets, don’t overlook IMPORTRANGE to suck in data to one spreadsheet from another. So useful and avoids repeating things over and over. Also helpful for getting round API call limits – get the data once, clone it from Sheet to Sheet.
This is fantastic! I also use Google Docs daily but had no idea how much I am missing out on. Thanks!
I use Google sheets every day but I’ve never known you could go that far with Google sheets.
Great post! Thanks so much!!
Absolutely sick post David, love your courses too. Keep it coming. Your vault of tools is one of the best gifts on the whole internet for people who are serious about automation.