A few months ago I saw this goofy looking kid getting his articles ranked high on two of my favorite marketing sites Inbound.org and Growthhackers. His name was Nate Desmond and what he was writing about was extremely impressive. Funny enough on his site was a link to hire him, I did part-time.
Since then he’s been impressively helping the AppSumo team with our latest product, SumoMe.com. He showed me a few weeks ago how he can simply scrape any website to get insanely actionable data. I forced him to teach it to you below, enjoy!
| Note: This is a guest post by Nate Desmond. Be sure to read to the end for a sweet bonus! |
——————————————————————————————————————-
Ever notice how some of your blog posts garner massive attention while others flop like a failed startup?
The funny thing is, if you just make a few small changes, you can dramatically increase social sharing for your posts. With a few minor changes you can easily grow faster and monetize better.
In analyzing OkDork, for instance, I found that using statistics in the headline increased engagement by more than 10x!
While some of these best practices hold consistently across different websites, others (like the best day of the week to publish) vary from blog to blog.
Thus, instead of relying on general statistics, I wanted to discover what actually worked best for my blog (hint: it didn’t always match the general statistics). Applying my background in accounting, I figured out how to scrape my blog and analyze the results. Then I documented the process to make it easy for you to do.
Analyzing your blog data is a three step process:
First, scrape your basic website information (titles, authors, categories, dates, etc).
Second, add social statistics for each post (Twitter, Facebook, Reddit, etc).
Finally, use Excel to uncover interesting correlations that will help you grow your blog faster.
Everything’s easier to learn with an example, so I will share how I ran this blog analysis on OkDork. For extra fun, I’ll also share statistics from a couple other major blogs at the end.
Here’s the visual guide to doing it yourself:
1. Scrape Your Blog’s Post Information
Alright, so let’s get into scraping.
Web scraping sounds like some super technical process only computer hackers in dark basements can do, but it’s actually pretty easy.
I personally use Import.io for all my scraping. It’s a visual scraper, so you don’t need to even learn a line of code. Alternatively, I’ve also heard good things Mozenda.
After installing Import.io, I navigate to OkDork’s blog homepage:
Within Import.io, navigate to your blog homepage
Like most blogs, Noah conveniently uses post archive pages. Starting with the blog homepage and paginating on to the very first post ever published, these archive pages make it easy for us to quickly harvest his blog data. <Insert Dr. Evil laugh here>

Completing the basic settings
Navigating to the correct URL within Import.io, you just need to create a few settings. Let Import.io run it’s optimization, select crawler mode, and choose the multiple rows option.
Training rows to create our API
Using the visual highlighter, select each post block (or “row”) and click “train rows”. As you select rows, Import.io will look at the code behind each element and create an API to automatically recognize additional rows. Normally the API will start working after you select 2-4 rows.
Training columns to create our API
Once the rows are trained, you need to add the “columns” (information like the title, date, and url). To pull the URL, select the title and choose to pull “html” instead of “text”. We’ll then parse this html within Excel later in the process to pull the URL.
You’ll also notice that the API didn’t work automatically for all the elements. For the “date” column, I had to train the API by selecting a couple of dates before it started pulling correctly.
Training additional pages to perfect the API
After training the first page, you’ll need to add at least five more to make sure the API is configured correctly. In analyzing OkDork, I actually had to add 10 pages before it was working smoothly.
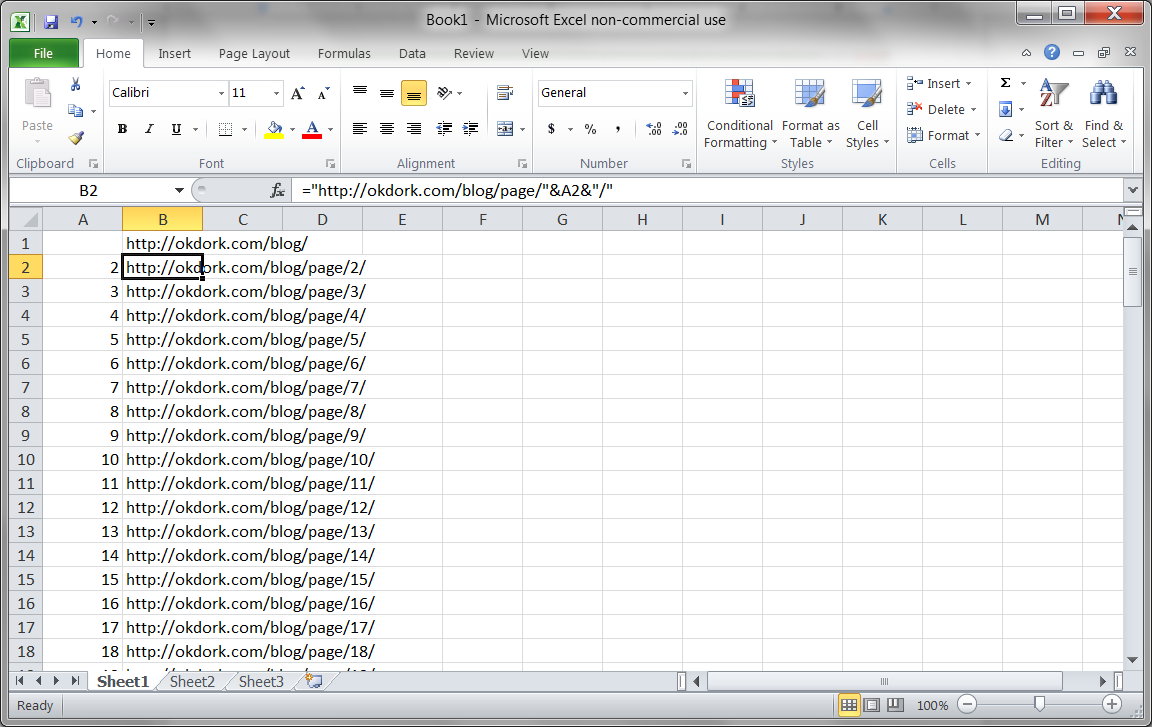
Using Excel to create a list of archive page URLs
Import.io also analyzes the URL structure of the pages you’ve added, so you can let it automatically crawl the website to find other archive pages. I’ve had a few problems with this feature though, so I prefer to generate the archive URLs myself.
Here’s the Excel formula I used for OkDork:
=”https://okdork.com/blog/page/”&A2&”/”
This combines the website URL with the page number in column A to quickly create a full list of 105 pages (the number currently on OkDork).
Running the crawler on OkDork
Pasting in the URLs generated in Excel and setting the page depth to “0” (so it won’t try to look for other pages), simply hit the big “Go” button. Sit back, eat some popcorn and enjoy the oncoming wave of data
2. Use Excel To Parse The URL
With the export downloaded in CSV format from Import.io, open the file in Excel. You will notice that the “URL” column actually contains the raw html links. We need to isolate the actual URL.
Using the “Text to Columns” function to isolate the post URL
To do this, simply move the URL column to the right most column and run a “Text to Columns” function. Choose “delimited” based on the quotation mark. From the resulting columns, find the column now containing the post’s URL and delete the extras.
Save this file as an Excel workbook.
3. Pull Social Stats for Each Post
We now have a beautiful list of urls, titles, comments, and dates. Before we can start analyzing though, we need to add the social stats for each post. We could manually look up each post on dozens of social networks, but wouldn’t it be nice to save a week of extra work?
Happily, you can use the OpenRefine program to easily (and freely) pull all the social statistics your heart desires.
For Mac
Download the OpenRefine application, drag the icon to your Applications folder, and double-click to launch.
For Windows
Simply download the .zip file, unzip the contents, and double-click on the google-refine.exe file. This will launch a command window and a new tab in your browser.[c][d]
Once OpenRefine is launched in either platform, upload your Excel file and create a new project.
Using OpenRefine To Pull Social Stats
With the project open, simply select to add a new column by fetching URLs based on the URL column (as shown above). Set the throttle delay to “1” so the process doesn’t take all day, and past this bit of code into the expression box:
‘https://api.sharedcount.com/?url=’ + value
Thanks to SharedCount’s API, you can pull social stats on up to 100,000 URLs per day for free.
Parsing the number of Facebook shares
Now we simply parse the social stats API return into separate columns for each social network.
Here’s the code for Facebook:
value.parseJson()[“Facebook”][“total_count”]
And here’s the code for every other platform (just switch the name):
value.parseJson()[“Pinterest”]
Once you have split social stats into separate columns, export the results back to Excel for the fun part — actually pulling results from the data.
Congratulations, you now have a fortune of social data on each blog post!
4. Combine Everything in Excel
Now that we have an export of hundreds of blog posts plus the social statistics for each one, we can start analyzing our data to find trends.
Adding formulas for day of the week and social totals
First, you’ll want to add two columns to Excel. Use the weekday formula to determine which day of the week each post was published:
=WEEKDAY(C2)
Then use a simple SUM formula to add all the social stats + comments to get an idea of the post’s popularity.
Case Study #1: Key Findings for OkDork
Alright, so now that we’ve got all this data, what did I find that can help OkDork grow faster?
Finding #1: Publish on Sunday, Monday, or Wednesday
Using a PivotTable to find average social score by day of week
The way I found this can seem a bit complicated, but it’s really pretty easy once you’ve done it.
In a new tab, insert a pivot table, and add the “day of week” column in the “Column Labels” box and the “social stats” column in the “Values” box.
Make sure to set the social stats field to “average” instead of the default “count” (see screencast above).
Based on the pivot table we ran above, Saturday seems to be by far the best day for Noah to publish. After all, Saturday posts averaged 962 social interactions vs the next best day at 167.
However, all findings need to be evaluated with the “common sense” test.
When I noticed that Saturday (traditionally a low day) performed 6x better than average, my suspicions were raised. Looking into the details, I found that most of Saturday’s number comes from one hugely popular post. With that outlier removed, the actual Saturday average is closer to 31.
Removing that outlier from the data, we find that Sunday, Monday, and Wednesday are the three best days for Noah to publish.
Finding #2: Headlines starting with “Why” or “How” perform above average
Using “Text-to-columns” and a Pivot Table to find the best headline wording
Using a simple “text-to-columns” function (use delimited by space), I can isolate the first word of each post’s title. Plugging this into our fancy Pivot table, we get a long list of social stats for each headline intro word.
The top three headline start words (based on avg social score) are “Why”, “One”, and “How”. The word “One” is only used in one post, though, so the sample size is too small to be significant.
After removing words that have only been used in one or two posts, we can see that “Why” and “How” reliably correlate to increased social sharing. “What” is the third place winner, but it performs far below the other two.
Finding #3: Headlines with statistics perform above average
Using a couple formulas to check headlines for statistics
I noticed that some of the top posts seemed to include statistics (e.g. “Why I got Fired from Facebook (a $100 Million dollar lesson)” and “Why Content Goes Viral: What Analyzing 100 Million Articles Taught Us.”). So I put together a formula to test my hypothesis.
I’m sure there’s a better way to do this, but this quick and dirty formula just checks each headline for numbers:
=IF(ISNUMBER(SEARCH(“1″,B2)),”Stat”,IF(ISNUMBER(SEARCH(“2″,B2)),”Stat”,IF(ISNUMBER(SEARCH(“3″,B2)),”Stat”,IF(ISNUMBER(SEARCH(“4″,B2)),”Stat”,IF(ISNUMBER(SEARCH(“5″,B2)),”Stat”,IF(ISNUMBER(SEARCH(“6″,B2)),”Stat”,IF(ISNUMBER(SEARCH(“7″,B2)),”Stat”,IF(ISNUMBER(SEARCH(“8″,B2)),”Stat”,IF(ISNUMBER(SEARCH(“9″,B2)),”Stat”,IF(ISNUMBER(SEARCH(“0″,B2)),”Stat”,”No Stat”))))))))))
With that data in hand, I simply ran another pivot table and found. Turns out, my hunch was right: Headlines with numbers perform approximately 10x better than headlines without.Click to Tweet
Case Study #2: Key Findings for Problogger
When I first started blogging 5+ years ago, Problogger was one of my favorite blogs to learn from. They’re still going strong today, so I thought it would be fun to run some numbers on their blog.
Key Finding #1: Monday is the best day to publish
Using a Pivot Table to find the best day for Problogger posts
Just like we did earlier for OkDork, I used a quick Pivot Table to find the best day of week for Problogger posts. Looks like Monday is a big day for Problogger (just like OkDork), but Problogger’s second best days are actually Thursday and Friday.
This is precisely why you should run these numbers on your blog. While OkDork and Problogger share some trends (Monday is good for both), they also are very different (Sun and Wed vs Thurs and Fri).
Key Finding #2: Guest posters get more social engagement
Using a Pivot Table to find the most popular authors
Since I was easily able to scrap the author names from Problogger, I wanted to see which authors wrote the most popular posts. Just running a Pivot Table and sorting by average score, we can quickly see these results.
Not surprisingly, Darren Rowse (the blog’s primary author) gets a very high social score. I was surprised to see, though, that guest authors actually score consistently higher. Probably because they bring some of their own audience.
It might be worth checking on your blog to see if guest authors similarly help bump social engagement.
Key Finding #3: Problogger readers are most active on Twitter (then Facebook)
Using a basic SUM formula to find the most popular sharing platforms
In marketing, you always want to discover where your customers are and meet them there. Thus, I’m interested to see where Problogger’s audience generally gathers on the internet.
Based on social sharing, it looks like Problogger readers are heavy Twitter users. Facebook also ranks quite highly, and LinkedIn makes a good showing.
Interestingly also, Problogger has a high volume of comments – more people comment than share on LinkedIn.
Case Study #3: GrowthHackers.com
So now that we’ve seen how data analysis works on blogs, lets try a different type of website. GrowthHackers.com is a community for growth professionals to share interesting articles and tips (highly recommended).
Key Finding #1: BrianBalfour.com drives the highest number of average votes
Using SUMIF and COUNTIF formulas to find blogs with the most votes
Say you wanted to write a few guest posts in the startup marketing area. You’d want to know which blogs drove the most engagement on GrowthHackers.com.
One key metric is the average number of votes that blog’s posts drive. Drawing from the raw list of posts, votes, and discussions I scraped from the website, I used a couple formulas to uncover the average votes per blog:
To find the total posts per blog:
=COUNTIF(Sheet1!F:F,A2)
To find the average votes per blog post:
=(SUMIF(Sheet1!F:F,A2,Sheet1!G:G))/D2
After removing duplicates (so each blog is only listed once), I also filtered out blogs with fewer than 6 posts (to remove statistical anomalies).
When looking at blogs with 5 or more posts shared on GrowthHackers.com, it looks like Brian Balfour’s blog leads the pack.
Key Finding #2: KISSmetric’s blog has the largest total impact
Using SUMIF and SUM formulas to find the blogs with the largest total footprint
So it’s fun to see which blogs drive the most engagement per post, but what blogs have the largest total impact on the GrowthHackers.com community?
To find this, I used two twin SUMIF formulas to find the total votes and discussions for each website:
=(SUMIF(Sheet1!F:F,A2,Sheet1!G:G))
=(SUMIF(Sheet1!F:F,A2,Sheet1!H:H))
Using a simple SUM formula to add the results, I sorted the entire list by total footprint (the sum of votes + comments).
Removing Medium from the rankings (since it’s a platform, not a blog), I discovered that the KISSmetrics blog has made the largest total impact on the GrowthHackers.com community with Moz.com coming in at a close second.
Now that you’ve seen the power of data analysis, what will you find on your own blog?
Click Below to Download the Exact Spreadsheet We Used to Analyze OkDork

————————————————————
Who is Nate?
An enthusiastic growth practitioner, you can find more of my marketing writing at NateDesmond.com.
When not playing with exciting data and studying behavioral psychology, you’ll probably find me practicing parkour (it’s like gymnastics) or reading a good book (currently loving Edmund Morris’ The Rise of Theodore Roosevelt).
48 responses to “Blogging Tips: How to 10x Your Blog With Data-Driven Insights”
Hi there, I’m a little late for the party, but turns out it’s for a good cause.
There is a problem with this method right now, this is what happened to api.sharecroud.com:
api.sharedcount.com is a deprecated endpoint and will be permanently discontinued on January 1, 2015. Free usage will continue to be available at free.sharedcount.com and requires an API key.
And when you use Nate’s code, Google refine hits you with this message:
Parsing error at offset 0: Missing number, string, identifier, regex, or parenthesized expression
Happily, there’s a solution for that:
1) You need to get a sharedcount.com account and validate your email address for your API key to be activated.
2) You paste this code
‘https://free.sharedcount.com/?apikey=YOUR-API-KEY&url=’ + value
And that awful message goes away for you to move on with your research.
Hope this helps.
Nate, this method you use is impressive!!!
Thank you very much Noah for forcing Nate to teach us this.
Best regards!!
By the way, this is where I got this info from:
https://www.programmingformarketers.com/lesson-6-how-to-scrape-any-blog-to-optimize-your-next-post/
(Sorry, forgot the attribution)
Just a quick note – Sorry but we’ve ruined your gif’s for the import.io bit 🙁 the extraction process has been shortened to only two steps now
– Cut and Paste –
and you don’t even need to download the browser anymore either, its all in browser, even mobile… It’s sad I know, it only takes seconds to do the scrape, where is the fun in that!?
Becuase I know this new will come as a terrible blow, i’ve gone ahead and make you a nice little extraction of the OKdork blog you can play with to cheer up: https://bit.ly/1qIbi7l
You can do your own blog, by visiting here: https://magic.import.io and pasting your blog URL in. Plus the old way of extracting via the desktop browser still works too ;o)
PS. In all seriousness, we are really super proud of this new technology, and would love you to try it. A pro tip is, if it doesn’t work first time, try going to page two of your blog and extracting that page first, this is cutting edge tech and doing that helps us detect the pagination.
Great post Nate! If you want to make step 3 easier, there’s a neat little tool for Google Sheets that can get social shares without the need for using Google Regine. It’s called SpreadsheetBooster. You can use it also to get MOZ data for URLs etc. if you like.
Cheers,
Martin
The animated gifs had my chrome browser crashing at least 5 times! But I finally made it to the end. pheww!
Good content.
I completely ran through this actionable post and followed along. I extracted so much data from my own blog that will definitely help me focus on growth. Thanks for the amazing post guys!
Great article, thank you, Noah. Really awesome animated GIFs.
Wow buddy nice tutorial helped me grow my blog i will also recommend others
This is some great stuff. Even tho I know I’m probably too lazy to do it on my own site (as well as it makes not so much sense, since it’s just a month old), but just the way you’ve put together this post is pretty great. I hope I’ll soon be able to publish similar high-quality posts like this one.
Impressive work!
Great post, Nate. I’m having a difficult time training the API for the “date” column. I can’t seem to select JUST the date when trying to train it. It always selects both “Comments” and “Date”
Any help would be appreciated.
Thanks,
James
Email support@import.io and they will give you free help and support.
One tip: try making sure you have the date data type selected for your column.
I like the idea but had trouble with the import.io program. There seems to be a missing step or I am going crazy (that just might be the case :D)
When training the rows on the page you want scraped and you click “I’ve got all 5 rows” it then asks you to add columns. No big deal – did that. Then it says to add another page – but it doesn’t state in the directions if you go to the previous posts on the blog and do add the rows again or go to the archives… or do I just do the same page again?
Doesn’t make sense to me.
So I tried navigating to the previous posts on the blog but when i click I’m There in the import.io it reloads the page to the front page of the blog. For example if I wanted http://www.smartpassiveincome.com/blog/ to be scraped I would navigate to the blog portion which would be scraped, smartpassiveincome.com/blog and then select the rows and add the columns then click add an additional page I would navigate to previous posts http://www.smartpassiveincome.com/blog/page/2/ then click I’m here in the import.io program and then it would reload to http://www.smartpassiveincome.com/blog/.
Is this a bug? Or am I doing something wrong?
Max
Hi Max, it sounds like you could use a point in the right direction from Alex at support@import.io. It almost certainly some thing simple.
From what I can tell… and i’m no support expert… it looks like you would be best using a crawler and training it on the individual post pages (with unique urls).
EG: train the browser on the following URLs:
https://www.smartpassiveincome.com/my-monthly-income-report-april-2014/
https://www.smartpassiveincome.com/stupid/
https://www.smartpassiveincome.com/blog-comments/
https://www.smartpassiveincome.com/quick-wins/
https://www.smartpassiveincome.com/5-five-minute-or-less-blogging-tips-that-yield-big-results/
not
https://www.smartpassiveincome.com/blog/
https://www.smartpassiveincome.com/blog/page/2/
https://www.smartpassiveincome.com/blog/page/3/ etc..
But like I say Alex will be happy to support you, and our support is free to all!
Good stuff! Reminds me how we used to use the exact same technique for SEO 15 years ago, when SEO was all about on-page text and page structure. Now it’s about optimizing for shares, but the approach is still valid and valuable.
Awesome useful information!
Thanks for sharing and keep update more.
Thanks Nate and Noah!
This one blog post could be a full on paid product.
Awesome.
Hey Nate and Noah,
Great post, with some awesome tools (import.io and OpenRefine) I didn’t know about, thank you for putting it all together!
A few comments on the process, which I went through several times this past weekend.
1. I didn’t need to do: Import.io > Excel > Refine > Excel. Refine has so much to offer, I was able to add what I needed there, and then export to Excel just once.
2. An Excel Table works well for the data. That way, you can add formulas for first word, stats, etc. to the “outer” columns, and just paste data to the inner columns, and the table will add formulas as needed to keep everything in synch.
3. A cool formula for determining if a cell contains numbers: =COUNT(FIND({0,1,2,3,4,5,6,7,8,9},A1))>0
4. You can link the same data to several pivot tables (pre-configured), so that you you can just refresh one pivot table and you’re in business.
After going through a learning curve with import.io (great tool) and OpenRefine, the process itself is pretty fast. Maybe 10-15 min, excluding time for scraping.
Nate, this is a great piece of information and am sure it took lots of time and efforts to put all these together. Yes it is huge and full of your experiences and surely it is going to take some time to consume, understand and explore this technique. Thanks Nate for writing and sharing this with us.
This here is some great technical information and very valuable for those looking to really make a success of their blog especially those is IM.
I feel a lot of this will be either to complicated for people to do or too much effort. HAHA but that’s fine by me, less competition 😛
Thanks for this bro much appreciated.
HI Noah
I have noticed (correct me if I’m wrong) that you have changed the title of the article.
Is that after you split test it?
Cheers
Aldo
WAY Too much work.
Why not just use these tools?
WordPress Social Sharing Plugin:
https://wordpress.org/plugins/social-sharing-stats/
or AddThis Analytics: https://support.addthis.com/customer/portal/articles/381250-analytics-overview#.U2PU3q1dVqs
Or am i missing something?
Artur | co-founder
JuicyCanvas
I’d never think that guest posts like the ones from problogger get consistent traffic. can you please share more information on that?
Hi Noah, hi Nate!
Thanks for sharing! Nice to see such an analytical approach to getting more impact online. Especially good job at the animated gifs… Really makes it far easier to understand and apply.
Do you guys have any hypothesis why monday (kind of) consistently outperforms other days? Like, people come out of the weekend and feel more like sharing?
Saludos!
Justin
Thats one hell of a post. I am sure lots of effort and creativity went into this . Thanks for putting together such useful piece of information. Nate you are awesome. Count me as a regular reader to your blog moving onwards.
It inspired to share my learnings on the subject
https://www.fortyfourmedia.com/how-to-find-out-what-your-readers-like-and-double-social-engagement/
Cheers
Aldo
Great post! Hey for the 1st step (scraping blog posts), wouldn’t pulling the urls from the xml sitemap (https://okdork.com/sitemap.xml) work instead of having to go down the import.io route?
Great article Nate! Thank you!
I do something very similar with my blog. One extra step is to add the number of pageviews (when you have it available of course) and express the ‘likes’ as number of likes per thousand views.
By doing so I can evaluate an article’s popularity independently by the number of times it has been viewed.
Also, beware of comparing article popularity if two articles have been published years apart.
The first readers soon after publication are more likely to be ‘true fans’ and more likely to click ‘Like’. As time goes by more readers happen to stumble on the article but, without the emotional engagement of a true fan, are less likely to show their appreciation for the content.
Over time the response is therefore diluted.
I found this to be true both for blog posts and youtube videos.
Cheers
Aldo
Nate, this is so amazing. Thanks so much for taking the time to share it. One question: when scraping a blog main page like this, how can I ensure the individual blog post URLs are incl. as a column since the individual blog post URLs aren’t actually noted on the blog main page (i.e. it’s not an element I can select/train to see as a column). Any help here would be much appreciated. THANKS again!
Its automatically done for you by import.io 🙂
If not, or if you have any trouble with it, just drop us an email via Support and we will fix you up.
I guess I have to read it a couple of times to really start putting it into action. As of now Buzzsumo and some IM news sharing sites were the only ways to find good content that could be used. Btw how do you do all those animations in those pics. I don’t know whether it’s good idea, too many of them makes me want to see none at all.
Noah this is like to eat Asado!
Really enjoyed the post and the practical manner of approaching analytics. I have a quick question about import.io – I don’t have dates on my blog posts (showing). Will import.io be able to source the publication date?
Thanks for the interesting article, looking forward to the next one!
Dan from import.io here: If the date is in your URL you could use that source. Import.io automatically records the page URL for you in your dataset.
If not you could include the publish date on your pages via the blog options, and the blog software will usually be able to back date that for you. Then you could grab that data. You could even hide the date again using CSS and import.io would still find it via xpath (just drop us an email to get free support).
Thanks Dan, really appreciate you jumping in with a solution. I pulled the dates to help the content remain a bit more evergreen and don’t have them in the titles. I’ll just put them back in, scrape and remove. Thanks again!
You’re welcome Michael; that seems like a good way to do it.
Thanks for commenting Dan. Any chance we can hook up the Okdork readers with 1-2 pro accounts 🙂
Sure thing Noah. The current free account covers the vast majority of individual/personal use cases; but we can give away a few special upgraded pro accounts for some ‘OKDorkers’ if they really want to push the boat out and make something awesome.
Drop me an email and we can fix that up for you ASAP.
Wow man this is absolutely awesome and looks extremely time consuming. But it provides pivotal (see what I did there?) data for farming and growing your blog. I will definitely use this strategy once I get my blog more off the ground. Great info man!
Hi All,
Great article (again!)
I was just wondering, what are some of your reasons for wanting to score high on blogposts? Maybe a obvious question, but I was just wondering.
They ask for your technical, creative, networking, inspirational and competitive skills. Where are all of you using the posts for? What are you selling and can you link sales directly to a blogpost? Or do you see it as sort of a internet marketing game?
Cheers,
Jonas
Hi Noah,
I’m not sure if you have already aware or have fix this one but I noticed on your email that the aweber link to your post will send your subscribers to an error (nothing found) page where it displays your latest post “Small Giants by Bo Burlingham — Book Review”. I believe there’s a small typographical error on the url that you put on aweber. It’s a matter of ‘trailing slash” issue. The correct URL should have the slash at the end while the one that you put on your email have no slash. You can try removing the slash at the end of this URL and it will give you an error page as mentioned above. Hope it helps.
Thanks a lot for sharing your knowledge. 🙂
Great post Nate! I can think of a lot of great applications for this technique.
The first thing I’ll probably do with it is determine the effectiveness of freelance writers who are writing for several blogs that I help manage. Know how many average social shares each author gets can tell me which writers should get more assignments and which should get less.
I definitely understand why Noah hired you after seeing ideas like this.
Looking forward to reading more articles from you.
Thanks Aaron! That is a great application.
Could also be fun for freelance writers to run this analysis on blogs they write for to optimize popularity. People will probably start noticing if all of a writer’s posts go viral. 😉
Nate, I was so impressed with your use of animated GIFs in this article that I just wrote this tutorial on “How To Create Animated GIF Screencasts”
https://aaronzakowski.com/how-to-create-animated-gif-screencasts/
You are the man Aaron. THanks for writing this up. Checking it out now!
If you want to go mad, you could create an Authenticated API into your Linkdex (or Majestic SEO) account and pull out how many links each article earned to add another metric for success of a blog. – Just a thought
Aaron,
You might want to take a look at how GigaOM done just that:
– https://gigaom.com/2014/01/21/analyzing-our-headlines-to-see-what-mattered-in-2013/
Thanks Mr Import.io! I’ll definitely check it out.
You’re welcome. And its Dan Cave (@dancave) 🙂